|
|
|
|


|
|
| |||||||||||||
|
| |||||||||
| |||||||||
|
KD Ricketts, CA Joseph, on behalf of the European Working Group for Legionella Infections Health Protection Agency Centre for Infections, Respiratory Diseases Department, London, United Kingdom
|
|
|
| Once a year, countries that collaborate in the
European Surveillance Scheme for Travel Associated Legionnaires’ Disease
(EWGLINET) are requested to submit a dataset that provides epidemiological
and microbiological information on cases of legionnaires’ disease
(nosocomial (hospital-acquired), community and travel related) detected in
their country for that year. This paper presents the data collected for
2003 and 2004. For this period, 9166 cases were reported to the dataset by
35 countries, of which 941 cases were associated with outbreaks. Fourteen
countries reported a total of 218 detected outbreaks. National infection
rates varied between countries from 28.7 to less than one case per million
population. This information is valuable in that it allows countries to
assess the effectiveness of their national surveillance schemes in
detecting cases. Over the two year period, 748 cases were reported to have died, giving a case fatality rate of 8.2%. The lack of detailed epidemiological information on deaths from legionnaires’ disease is highlighted. The establishment of the European Centre for Disease Prevention and Control is seen as an opportunity to develop European collaborations more fully, and to increase further the protection of Europeans from outbreaks of legionnaires’ disease. |
|
Introduction
Legionnaires’ disease was first identified in 1976 following an outbreak of pneumonic illness at a hotel hosting an American Legion convention. In 1986, the European Working Group for Legionella Infections (EWGLI) was established to exchange knowledge and to monitor trends of legionnaires’ disease across Europe; in 1987 EWGLI established the European Surveillance Scheme for Travel Associated Legionnaires’ Disease (EWGLINET). Data on trends of legionnaires’ disease in Europe between 1996 and 2002 have already been published [1-5]. This paper presents data from European countries for the years 2003-2004. Methods A confirmed case of legionnaires’ disease is defined as an acute lower respiratory infection with focal signs of pneumonia on clinical examination and/or radiological evidence of pneumonia, and one or more of the following microbiological diagnoses: isolation/culture, serology (a fourfold rise in antibody titre to Legionella pneumophila serogroup 1), or urinary antigen test. A presumptive case requires the same clinical evidence of infection, and one or more of the following microbiological diagnoses: serology (a fourfold rise in antibody titre to non Legionella pneumophila serogroup 1, or a single high titre in antibody), antigen in respiratory secretion, direct fluorescent antibody (DFA), or other accepted method of diagnosis (e.g. PCR). If the method of diagnosis is not known, the cases will be classified as such (‘diagnosis not known’) for the purposes of the annual dataset. A case of legionnaires’ disease is further defined by exposure history. Each country allocates their cases to the categories of ‘travel’, ‘nosocomial’ (hospital acquired), and ‘community’ according to their national definitions. If a case falls into more than one category (for instance, if they had both travel and nosocomial history), the collaborator in the country of infection would exercise discretion in classifying the case based on their exposure history. Such instances are rare. The data for the annual dataset is collected in seven specific tables. The first table records the number of confirmed and presumptive cases diagnosed in each country each year, and how many of those cases died. The table also asks for a population base so that a rate per million population can be calculated. The second and third tables record the methods of diagnosis used, and detailed information on the species and serogroup of any isolates collected. The fourth table requests information on age group and sex, the fifth table asks for the category of exposure (hospital [nosocomial], travel, community), and the sixth table gives the countries of travel for travel-associated cases. The seventh table gives details of outbreaks by type, size and suspected source. Incidences per million population are used in this paper as an analysis tool, and were calculated as the number of cases reported by a country of infection, divided by the population size of that country. Regional population sizes rather than national population sizes were provided by collaborators for six countries in 2003 (Croatia, Czech Republic, Greece, Romania, Russia and Turkey) and for four countries in 2004 (Croatia, Czech Republic, Romania and Russia), because only regional data on legionnaires’ disease was available to the collaborator. Regional rather than national infection rates were therefore calculated for these countries and it should be noted that these data may not be representative of the national incidences. Results
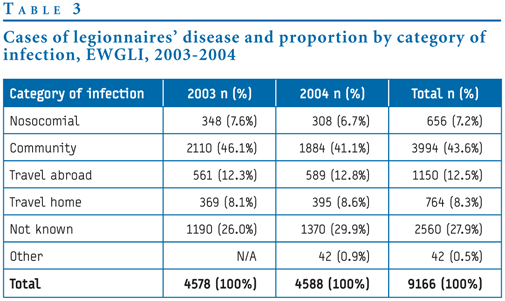
Incidence per million population The overall incidence for Europe (as calculated from the annual dataset) was 9.8/1 000 000 in 2003 (based on a denominator population of 468 million) and 8.2/1 000 000 in 2004 (based on a denominator of 557 million). Category of cases For the two years 2003-2004, 656 cases were reported as nosocomial (7.6% in 2003, 6.7% in 2004), 3994 as community acquired (46.1% in 2003, 41.1% in 2004), 1150 as associated with travel abroad (12.3% in 2003, 12.8% in 2004), 764 as associated with travel in the same country as country of residence (8.1% in 2003, 8.6% in 2004), and 2560 were reported as category ‘not known’ (26.0% in 2003, 29.9% in 2004). An additional category of ‘other’ was added in 2004, and registered 42 cases (0.9% in 2004) [TABLE 3]. In 2004, cases were allocated to the ‘not known’ category if there was no exposure information available, and to the ‘other’ category if the exposure information was not sufficient to allocate them to one of the existing categories (e.g., if the collaborator was not able to separate nosocomial from community cases in their data).
Outbreaks
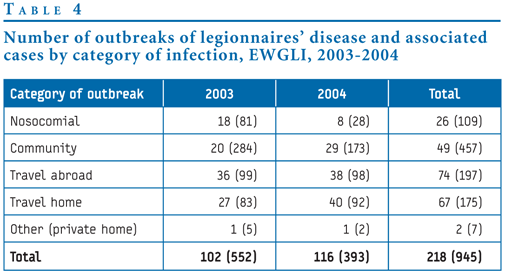
Twenty six outbreaks (11.9%) involving 109 cases were linked to hospitals and occurred in Austria, Denmark, England and Wales, Germany, Italy and Spain. Twenty five of these nosocomial outbreaks were attributed to contaminated hot or cold water systems, and one to an unknown source. These sources are as reported by collaborators, and the standard of investigation may vary between countries. Some outbreaks may have had microbiological confirmation of matching between environmental and clinical strains, but this is still highly unusual. Most of the sources reported would have been identified as a ‘most likely’ source. Forty nine outbreaks (22.5%) were linked to community settings, and were associated with 457 cases. They occurred in England and Wales, France, Hungary, Italy, the Netherlands, Norway, Scotland, Spain and Sweden. Cooling towers were identified as the source in 16 of the community outbreaks, four outbreaks were attributed to contaminated hot or cold water systems, three to whirlpool spas, and 26 to an unknown source. One hundred and forty one of the outbreaks were travel associated, of which 74 (33.9%) were linked to travel outside the country of residence of the case, and 67 (30.7%) were linked to travel within the same country of residence. Where the source of infection was identified, hot or cold water systems were responsible in 38 outbreaks, whirlpool spas in seven, and the remaining 96 sources were unknown. Two outbreaks were reported to be linked to private homes in Germany (one in each year). The source of infection was not identified for the first outbreak, reported in 2003, but the second outbreak, in 2004 was reported to be linked to a whirlpool spa. Overall, countries reported 552 cases associated with 102 outbreaks in 2003, and 393 cases associated with 116 outbreaks in 2004. This gives an average of 4.3 cases associated with each outbreak over the two year period. The outbreaks ranged in size from two cases to 84, this latter outbreak being a 2003 community cluster in France. The largest cluster reported in 2004 was a 32 case community cluster in Spain. Travel-related legionella
infections The highest number of cases over the two year period was associated with travel to Spain (419 cases), followed by travel to France (315) and travel to Italy (308). However, 87%, 69% and 86% respectively of the travel associated cases in these countries occurred as a result of travel by Spanish, French and Italian nationals within their own country. Of all travel-associated cases, 66 (3.4%) were in patients who had travelled in more than one European country, and 15 (0.8%) were in patients who had travelled in more than one non-European country. Five cases were associated with travelling on cruise ships (three English cases in 2003: one from Newcastle to Holland, one on a cruise around the Mediterranean, and one on a cruise between Tenerife, Madeira and Gran Canaria; and two cases in 2004: a Belgian case travelling from Greece to Italy, and a Danish case on a Mediterranean cruise). A more comprehensive analysis of the travel-associated cases of legionnaires’ disease is published separately [6]. The EWGLINET definition of a travel-associated case is any case in a person who stayed overnight at a public accommodation site during the two to ten days prior to onset of symptoms. A total of 632 cases of travel-associated legionnaires’ disease from 24 countries fulfilled this definition and were reported to the EWGLINET surveillance system in 2003. Most cases that were not reported to EWGLINET were in patients who had stayed in private accommodation, or for whom travel information was incomplete, or travel did not fall within the strict 2-10 day incubation period required by EWGLINET. Eighty nine clusters were detected, 35 (39%) of which only involved one case from one country, and so would not have been detected without EWGLINET. Main methods of diagnosis
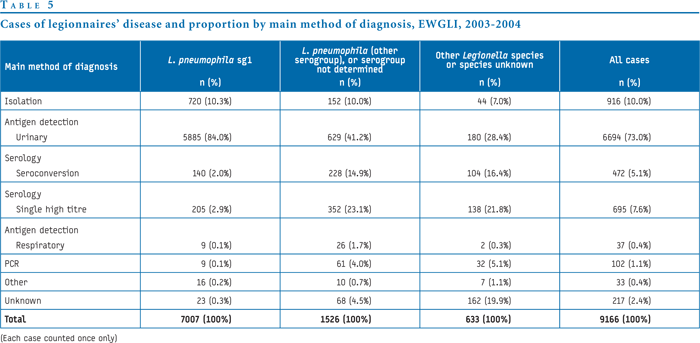
In 2004, culture of the organism accounted for 491 (10.7%) of all cases, compared with 425 (9.3%) in 2003. Cases diagnosed by urinary antigen detection also increased from 3288 (71.8%) to 3406 (74.2%), while the proportion of cases diagnosed serologically, either by seroconversion or by single high titre, fell from 13.6% to 11.8%. L. pneumophila sg1 infection accounted for 7007 (76.4%) of the total number of cases, 10.3% of which were diagnosed by culture, and 84.0% by urinary antigen. L. pneumophila other serogroup or serogroup not determined accounted for 1526 (16.6%) reports, of which 10.0% were diagnosed by culture, 41.2% were diagnosed by urinary antigen detection, and most of the remainder (38.0%) were diagnosed by serology (seroconversion or a single high titre). 633 cases (6.9%) were reported as other Legionella species or species unknown, the proportion increasing from 6.0% to 7.8% between 2003 and 2004. Of the 916 isolates reported, 720 (78.6%) were due to L. pneumophila sg1 infection, 77 (8.4%) were L. pneumophila serogroup unknown, and 75 (8.2%) were serogroups 2-15. Fifteen isolates were diagnosed as other species of Legionella. These were reported as L. bozemanii (5), L. dumoffii (2), L. gormanii (1), L. longbeachae (6), and L. micdadei (1). For 29 isolates the Legionella species was not given. Deaths
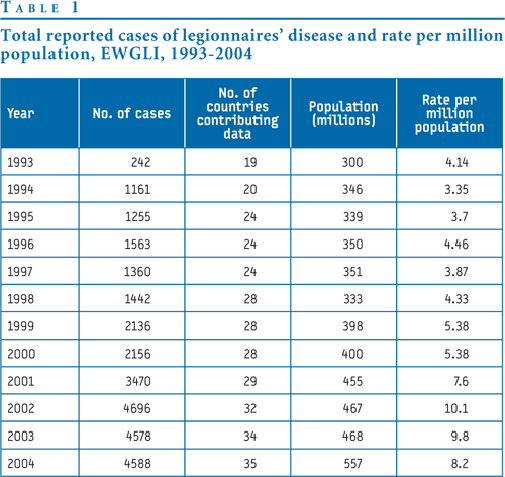
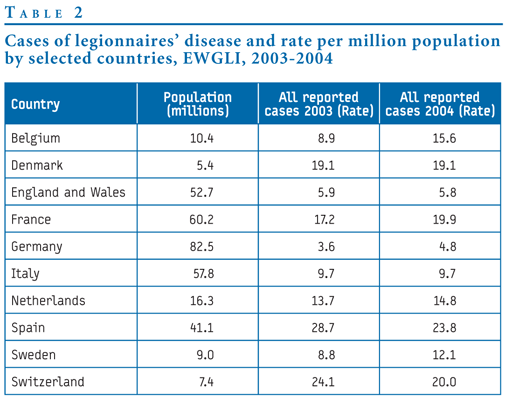
The European rates of legionnaires’ disease per million population recorded by EWGLI’s annual datasets since 1993 have shown an overall increase. From 1993 to 2000, incidence varied between 3.35 and 5.38 cases per million population, but from 2001 to 2004, the incidence ranged from 7.6 to 10.1. The changes in diagnostics and strengthening of surveillance systems that have prompted this higher incidence have been discussed previously [5]. Incidence was lower in 2004 than in 2003 because the denominator (total population) increased from 468 million to 557 million. This is due partly to the addition of Andorra to the dataset in 2004, but is also due to Greece and Turkey providing population sizes only for areas of their two countries in 2003, but for the entire national populations in 2004. The incidences recorded in the annual datasets vary widely between countries, and suggest that there may be poor ascertainment, under-reporting or a lack of diagnoses taking place in some areas of Europe. The dataset identifies those countries with unusually low rates, and shows the rates that other European countries are detecting and reporting, thereby allowing collaborators to set their own targets for improvement. The lack of national data in a number of countries is a cause of some concern. Decision 2119/98/EC made it mandatory for European Union countries to have national surveillance systems in place for infectious diseases including legionnaires’ disease [7]. Despite this, some countries still rely on laboratory reports to give an estimate of the number of cases found in their population each year, and this system does not always extend nationally. This applies to some of the new EU countries. It is hoped that participation in EWGLINET and meeting EWGLINET’s standard for good quality data will strengthen their national surveillance systems. As an example, the identification of cases by species and serogroup needs to be improved throughout Europe and reported through the system to the national level. At present, 41.2% of cases reported as ‘L. pneumophila other serogroup or serogroup not determined’ were diagnosed by urinary antigen detection. Because this test detects specific antigens, it should allow countries to assign each case to a serogroup, and so EWGLI should not be receiving reports where the serogroup is unknown. This is a reporting problem in some countries; laboratories do not pass on the serogroup information, and as a result, the final dataset is less accurate than it could be. EWGLI’s desire for good quality data should motivate collaborators to encourage their laboratories to report full microbiological information. The collection of this annual dataset itself helps to strengthen national schemes. It requires all EWGLI collaborating countries to complete and clean their national datasets once a year, forwarding to EWGLI’s coordinating centre as complete a set of information as is possible. An area of reporting that needs to be improved by all countries is data on deaths. The breakdown of such death data by age, sex, category of case and links to outbreaks would be extremely informative. More accurate, detailed mortality information would allow national surveillance systems (in conjunction with morbidity data) to identify particular demographic groups with high case fatality rates, thereby identifying areas to target legislation and control measures. The annual dataset provides an opportunity to gather information on all outbreaks of legionnaires’ disease that were identified in a particular year by national surveillance schemes throughout Europe. The number of nosocomial outbreaks dropped from 18 to eight between 2003 and 2004, suggesting an improvement in the control and prevention of legionnaires’ disease in hospitals. In contrast, the number of outbreaks associated with travel within a case’s own country increased from 17 to 40. This may be due in part to EWGLINET’s recent emphasis on the importance of ensuring such cases are classified as ‘travel’ cases, even when no foreign travel is involved [6]. Of note also is the decrease in the number of cases associated with community outbreaks, despite the increasing number of such outbreaks. This suggests that countries are improving their response to community outbreaks when they occur, and are ensuring that the number of cases involved is kept to a minimum [TABLE 4]. With the establishment of the European Centre for Disease Prevention and Control (ECDC) [8], there is the opportunity for further growth and development of all Disease Specific Networks (DSNs), including EWGLINET. A close relationship between EWGLINET and the ECDC should make it possible to share data more widely amongst the countries of Europe, and should allow for a more effective dissemination of early warnings to ensure a greater response. EWGLINET is a very successful DSN. More countries are submitting annual datasets to EWGLINET each year, which shows the close collaboration that has been achieved between member states and the good quality data that such collaborations can produce. Acknowledgements We would like to thank our collaborators for completing
their annual datasets, and Ms Anitra Jones for her assistance in collating
the data. |
|
|
|
References 1. Anonymous. Legionnaires’ disease in Europe, 1996. Wkly Epidemiol
Rec. 1997;72:253-260. |
| ||||
|